ERAA 2025Modelling data
Overview of power system and assumptions
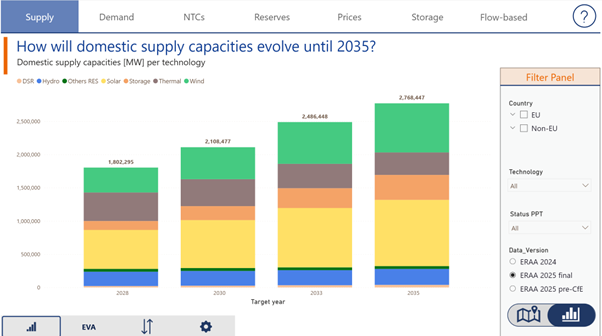
Domestic Supply
The absolute generation capacities visual presents the domestic supply capacities (in MW) per technology for each target year (TY). A map and graph visualization are available for further exploration.
The variation in supply capacities visual displays the change in domestic supply capacities (in MW) per technology between 2028 and 2035.
The RES electricity generation potential visual illustrates the potential electricity generation (in TWh) from hydro, large-scale solar, and wind sources per TY.
The thermal unit maintenance visual presents the percentage of thermal units under maintenance throughout the year for each TY.
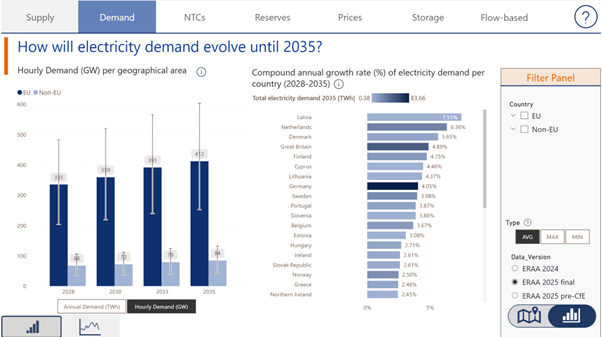
Electricity Demand
The aggregated yearly data presents the annual electricity demand (in TWh) for each TY, aggregated by geographical area (EU and non-EU). Below the figure, clicking on “Peak Demand (GW)” reveals the annual peak demand by TY and geographical area. It also includes the compound annual growth rate (CAGR) of electricity demand per country from 2028 to 2035. A map and graph visualization are available under the Filter Panel for further exploration.
Additionally, the daily time series illustrates the evolution of daily gross electricity demand (in GWh) for each TY.
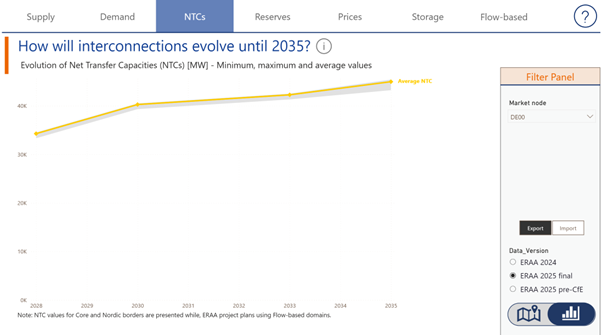
Net Transfer Capacities (NTCs)
The net transfer capacities visual presents the evolution of net transfer capacities (in MW) over time. A map and graph visualization are available for further exploration.
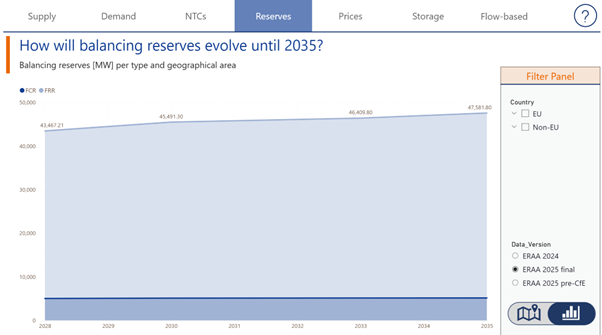
Balancing Reserves
The visual represents the balancing reserves per type and geographical area (in MW) over time. A map and graph visualization are available for further exploration.
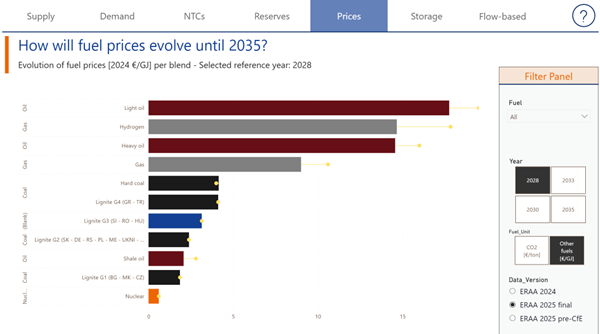
Fuel prices
The visual presents the evolution of prices per fuel blend (in 2023 EUR/ton) per TY. A map and graph visualization are available for further exploration.
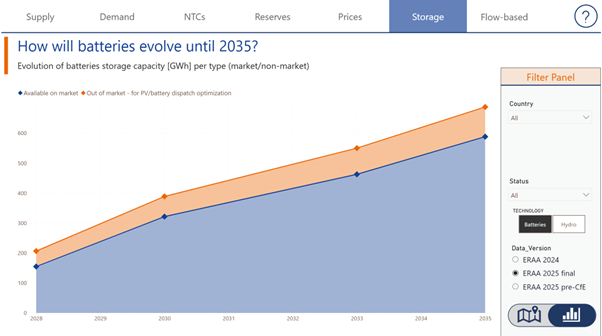
Storage
The visual presents the evolution of battery storage capacity per type (in GWh) over time. A map and graph visualization are available for further exploration.
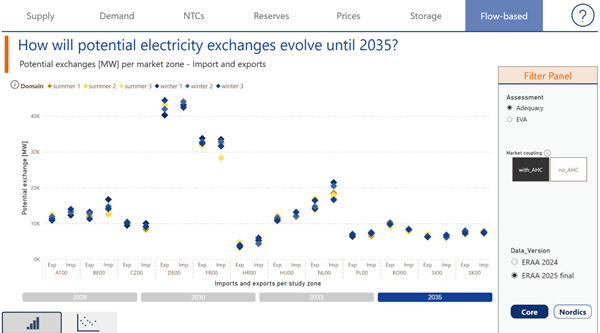
Flow-based domains
- The Flow-Based visual presents a static view of net positions, illustrating the potential exchanges (in MW) per market zone, including imports and exports for each TY. In the bottom left corner, an option allows selecting the evolution of values per study zone, while the bottom right corner provides a selection between the Core region and the Nordics region.
Input Data
All input data and assumptions can be consulted in detail in the files below and in ERAA 2025 Annex 1.
- Data Collection Guidelines (PDF, 475 KB)
- General information - Common Data (ZIP, 82 KB)
- Dashboard - Raw data (ZIP, 18 MB)
- Demand Data (ZIP, 432 MB)
- Economic and Technical Investment Parameters (ZIP, 209 KB)
- FB Domains (ZIP, 11 MB)
- NTCs (ZIP, 18 MB)
- Other Data (ZIP, 98 KB)
- PECD (ZIP, 1 GB)
- PECD Weather (ZIP, 2 GB)
- Explanatory Note on Data Release (final datasets) (PDF, 746 KB)
- Data change log (TXT, 1 KB)