2024
ERAA 2024Reports & Results
Reports
ERAA 2024: Executive Report
Download (PDF, 3.9 MB)
Annex 1: Input Data & Assumptions
Download (PDF, 5.1 MB)
Annex 2: Methodology
Download (PDF, 3.7 MB)
Annex 3: Detailed Results
Download (PDF, 3.4 MB)
Annex 4: Case Study - Application of Revenue-Based EVA Approach on European Scale
Download (PDF, 1 MB)
Annex 5: Country Comments
Download (PDF, 1.5 MB)
Annex 6: Definitions and Glossary
Download (PDF, 490 KB)
Outputs
Adequacy results
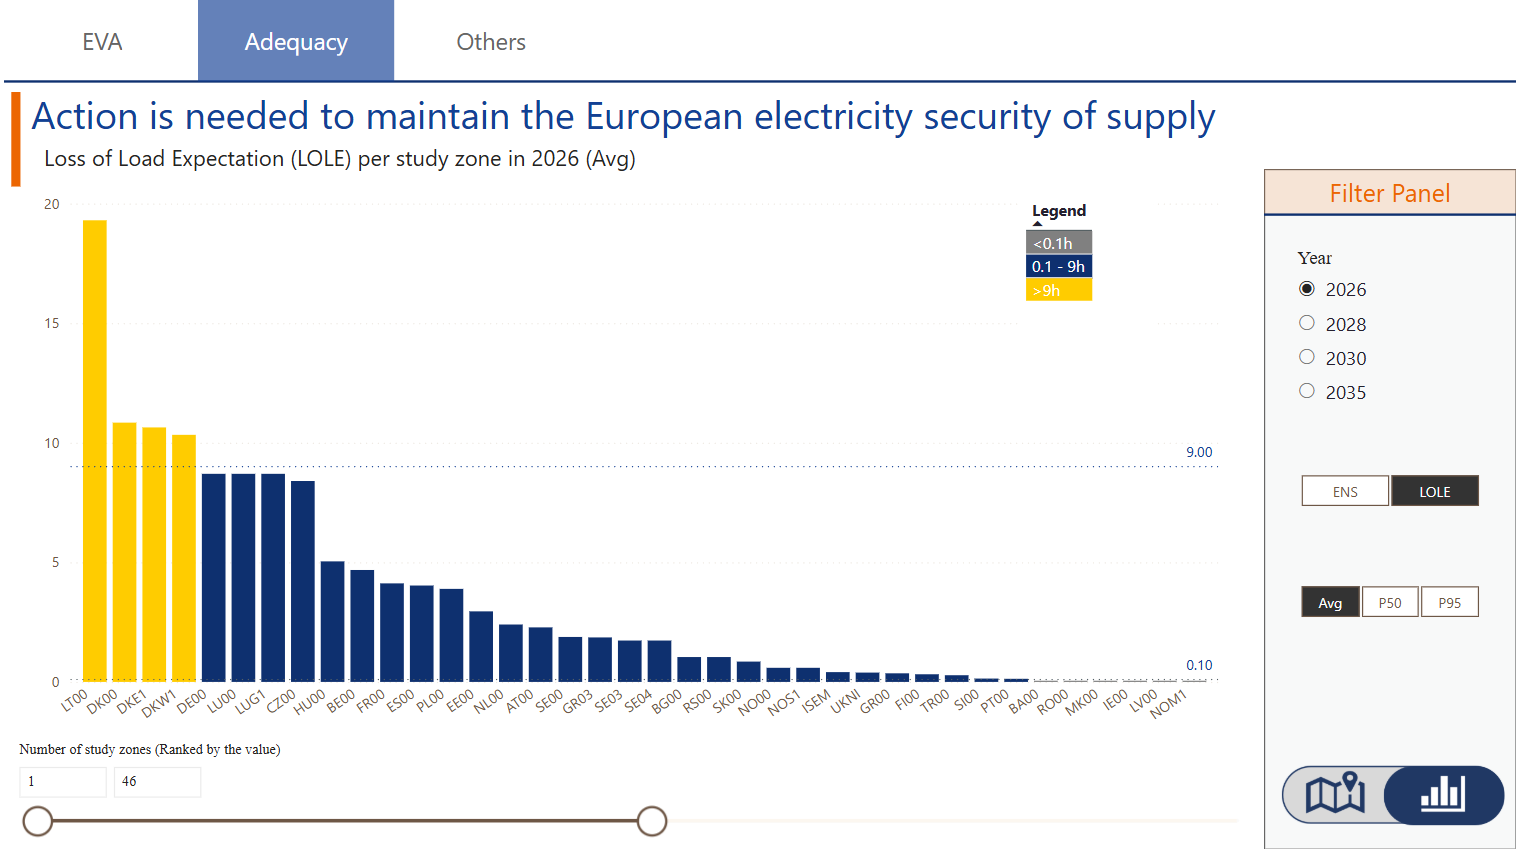
Under the adequacy tab, it is possible to visualise the Energy Non-Served (ENS) as well as the Loss of Load Expectation (LOLE) per study zone for a given year. The user can choose to visualise the ENS or LOLE using the command in the Filter Panel. In addition, the Filter Panel allows selecting different Target Years and adjusting other parameters. An option to visualize the data in a graph or map is available for further exploration.
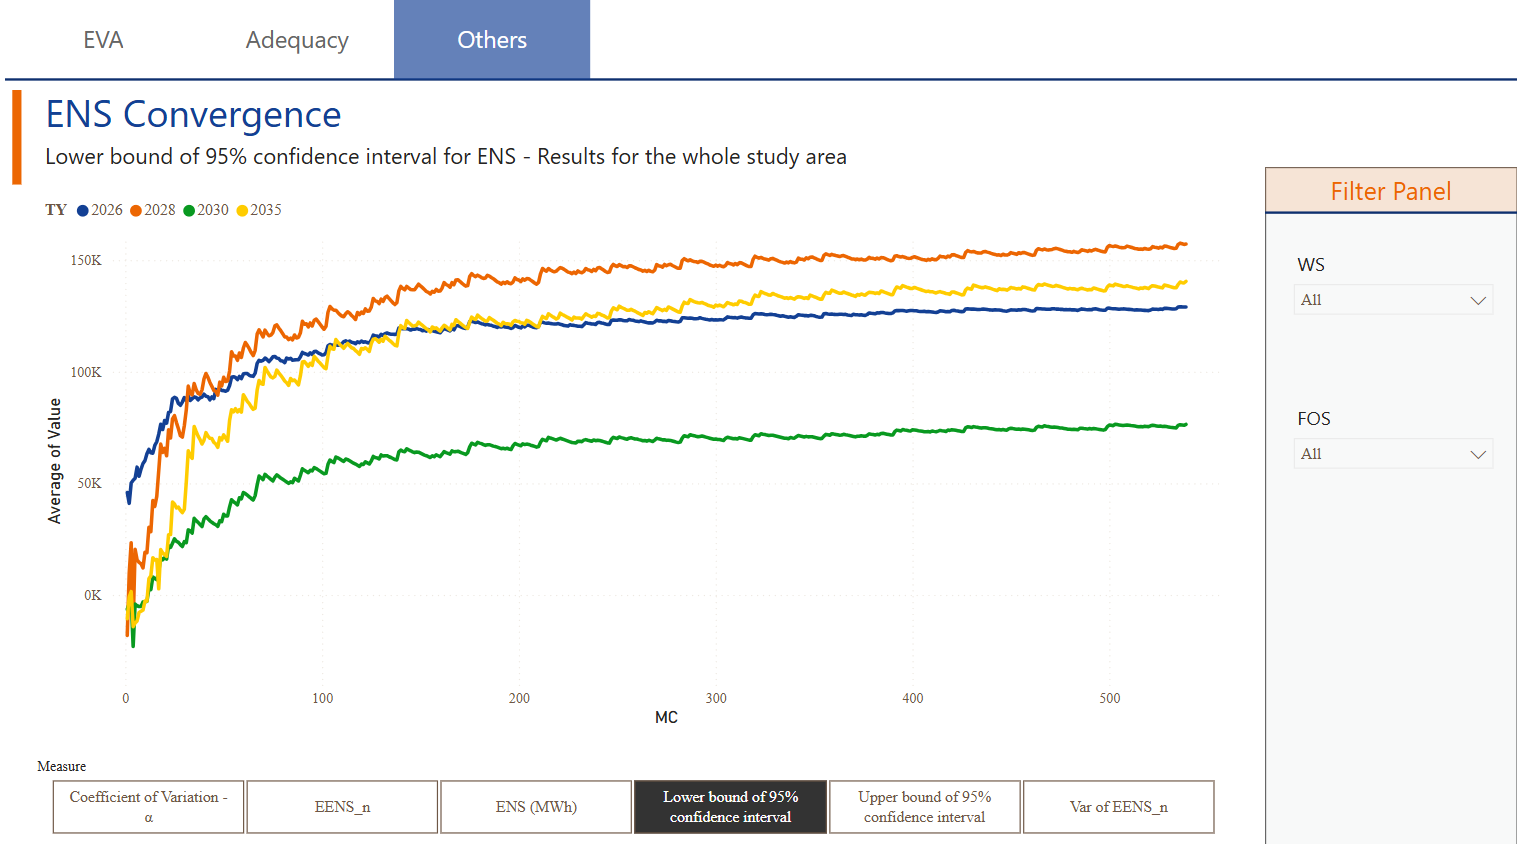
ENS Convergence
The Energy Not Served (ENS) Convergence visual presents six different measures, each with a distinct visualization. The desired measure can be selected in the bottom of the page.
- The Coefficient of Variation displays results for the entire study area per Target Year.
- The EENS shows the cumulative ENS (EENS) across MC samples for the entire study area per Target Year.
- The ENS (MWh) shows results for the entire study area per Target Year.
- The Lower Bound of the 95% Confidence Interval presents values for the entire study area per Target Year.
- The Upper Bound of the 95% Confidence Interval provides values for the entire study area per Target Year.
- The Variance of EENS_N is shown for the entire study area per Target Year.