2025
ERAA 2025Reports & Results
Reports
ERAA 2025: Executive Report
Download (PDF, 3.1 MB)
Annex 1: Input Data & Assumptions
Download (PDF, 9.3 MB)
Annex 2: Methodology
Download (PDF, 6.0 MB)
Annex 3: Detailed Results
Download (PDF, 3.2 MB)
Annex 4: Scarcity Events Analysis
Download (PDF, 33.9 MB)
Annex 5: Proof of Concept: Application of Revenue-Based EVA Approach on European Scale
Download (PDF, 1.4 MB)
Annex 6: Country Comments
Download (PDF, 1.4 MB)
Annex 7: Definitions and Glossary
Download (PDF, 455 KB)
Outputs
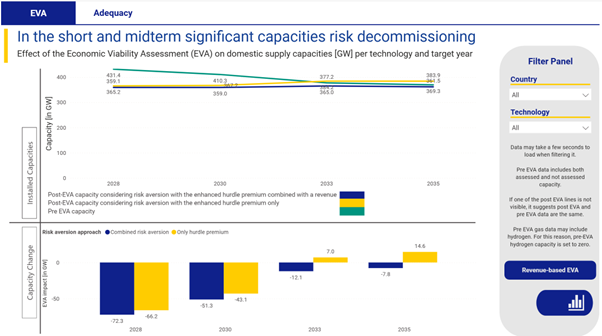
EVA results
The Economic Viability Assessment (EVA) visual presents the effect of the EVA on domestic supply capacities (in MW) per technology and Target Year. An option to visualize the data in a graph or map is available for further exploration.
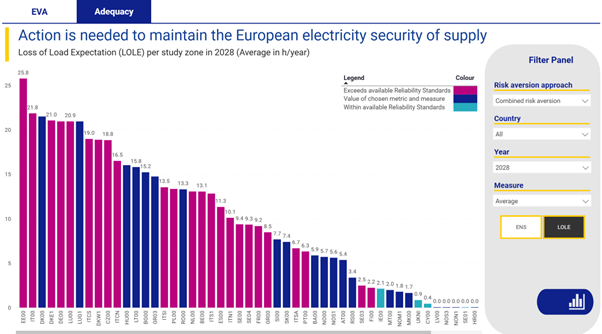
Adequacy results
Under the adequacy tab, it is possible to visualise the Energy Non-Served (ENS) as well as the Loss of Load Expectation (LOLE) per study zone for a given year. The user can choose to visualise the ENS or LOLE using the command in the Filter Panel. In addition, the Filter Panel allows selecting different Target Years and adjusting other parameters. An option to visualize the data in a graph or map is available for further exploration.