Key takeaways of the ERAA 2021
For Target Year (TY) 2025, the results of the ERAA 2021 show that the evolving economics of thermal generation, driven in particular by increasing integration of RES and evolutions in carbon pricing, will put downward pressure on capacity. This will require the implementation of new flexibility tools allowing the management of demand (ramps and peaks). It further necessitates capacity which can quickly respond to sudden variation of demand and supply; for instance, evening fast increasing demand while decreasing PV supply. Furthermore, without intervention (see scenario Economic Viability Assessment (EVA) without Capacity Mechanisms (CM) – TY 2025) risks of system inadequacy rise significantly in more than a dozen markets.
The need for coordination is underlined by the finding that adequacy issues in one country are highly dependent on assumptions in neighbouring countries, and, reciprocally, any capacity investment in one country can greatly influence its neighbours. This highlights the importance of regional coordination in decision making. The central reference scenarios ( with/without CM for TY 2025) suggest that Central and Western Europe have especially low margins, with LOLE estimates of several hours for most countries in the region. On the other hand, Southern Europe seems to be more robust adequacy-wise, with the exception of islands (Malta, Sardinia, Cyprus), due to their limited interconnection capacity.
In the longer term, i.e. target year 2030, the bottom-up analysis (i.e. National Estimates scenarios) shows important risks for the economic viability of the assumed thermal generation fleet. The qualitative approach used in this edition for 2030 is a first step.
Refining in the next ERAA editions will allow for a better view on long-term assessment. Therefore, a one-on-one quantitative comparison with the 2025 results is not valid. In addition, there will always be even more uncertainty for long term than for midterm; thus, those results should be seen from a different perspective.
The above key takeaways show the contribution of CMs to ensuring system adequacy, though the ERAA 2021 does not specify in which technologies or geographic locations within a region. The ERAA is an innovative product, giving visibility on the impact of climate policies on the adequacy of the system with an acceptable level of approximation. Future editions will take the learnings of the ERAA 2021, including the new approaches such as the EVA and Flow-Based (FB) analysis, and, after further improvement, apply them to an increasing number of TYs and scenarios. Nonetheless, this first edition is already a significant leap forward compared to its predecessor MAF. For the future editions, an important range of uncertainty will intrinsically remain, even as models grow increasingly robust and are applied more widely. For this reason, the ERAA should not be considered as the only tool for decision-makers as other parameters (e.g. congestion management) should be considered as relevant.
As the ERAA develops towards the target methodology, it will factor in new assumptions and data, as well as the evolving policy environment. Although this will inevitably change the specific results, ENTSO-E is confident that the general findings outlined in the ERAA 2021 will remain valid.
Main findings of the ERAA 2021
National Estimates scenario
As a bottom-up scenario it does not include any economic viability assessment1. Figure 1 illustrates that this scenario does not show any significant risk in most of the European perimeter. Naturally, islands are expected to face adequacy risks more commonly than the rest of Europe, thus even for this scenario Malta2, Sardinia and Sicily are identified with a high number of hours of loss of load expectation. More specifically, the planned coal phase-out in Sardinia creates adequacy concerns, if not counterbalanced by a stronger interconnection with the Italian peninsula and some replacement capacity. Lithuania also shows considerable adequacy risks for this scenario (7.5h), followed by Finland (1.5h), France (0.9h) and Ireland (0.9h).
National Estimates3 scenario for 2030 does not differ in terms of adequacy issues in Europe, compared to target year 2025. The high scarcity risk in Sardinia is no longer present due to the planned grid development and the new generation resources hypothesized. From the islands, only Malta remains under risk even though that risk is expected to be reduced compared to target year 2025; this is also the case for Lithuania. New scarcity appears in Denmark (6.4h) due to higher demand levels but apart from that all other zones, according to this scenario, are without scarcity risks under the capacity assumptions of this scenario.
1 An assessment of revenues and costs derived from the economic dispatch results are presented in Annex 2, complementing the adequacy results for the National Estimates scenarios.
2 Adequacy results in ERAA 2021 consider only resource available in the market. In Malta, 215 MW of non-market resource is available and would mitigate the risk of scarcity.
3 An assessment of revenues and costs derived from the economic dispatch results are presented in Annex 2, complemented the adequacy results for the National Estimates scenarios.
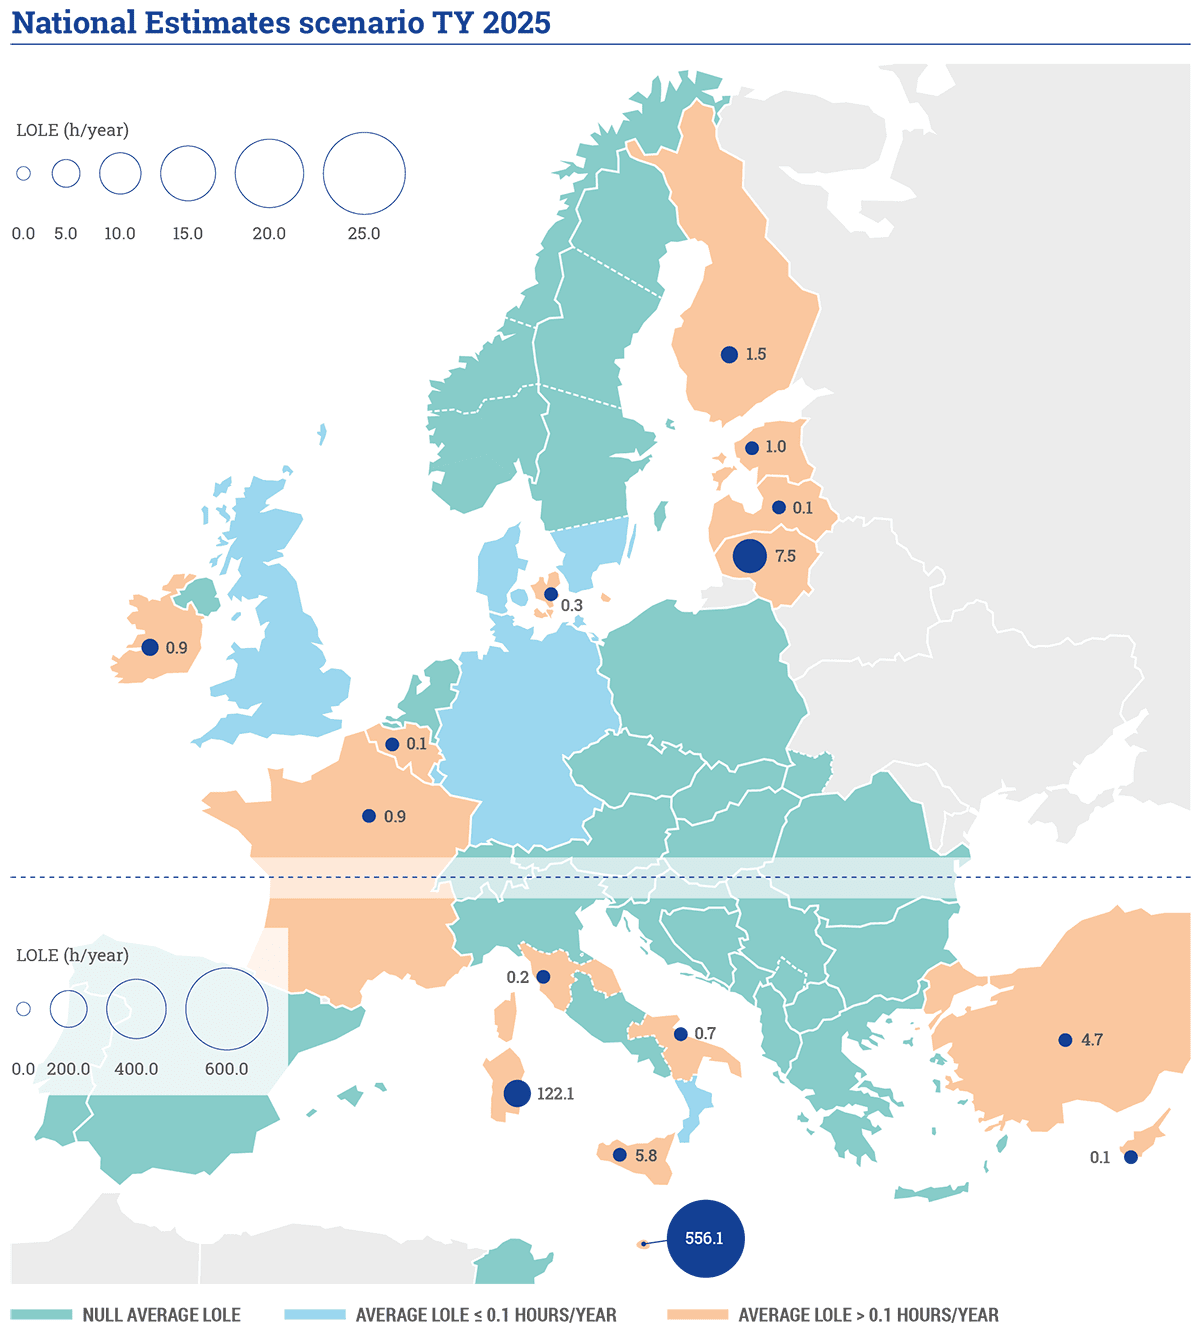
Figure 1: LOLE values for the scenario ‘National Estimates 2025’. Circles for bidding zones with LOLE values smaller than 0.1 hours/year are not represented.
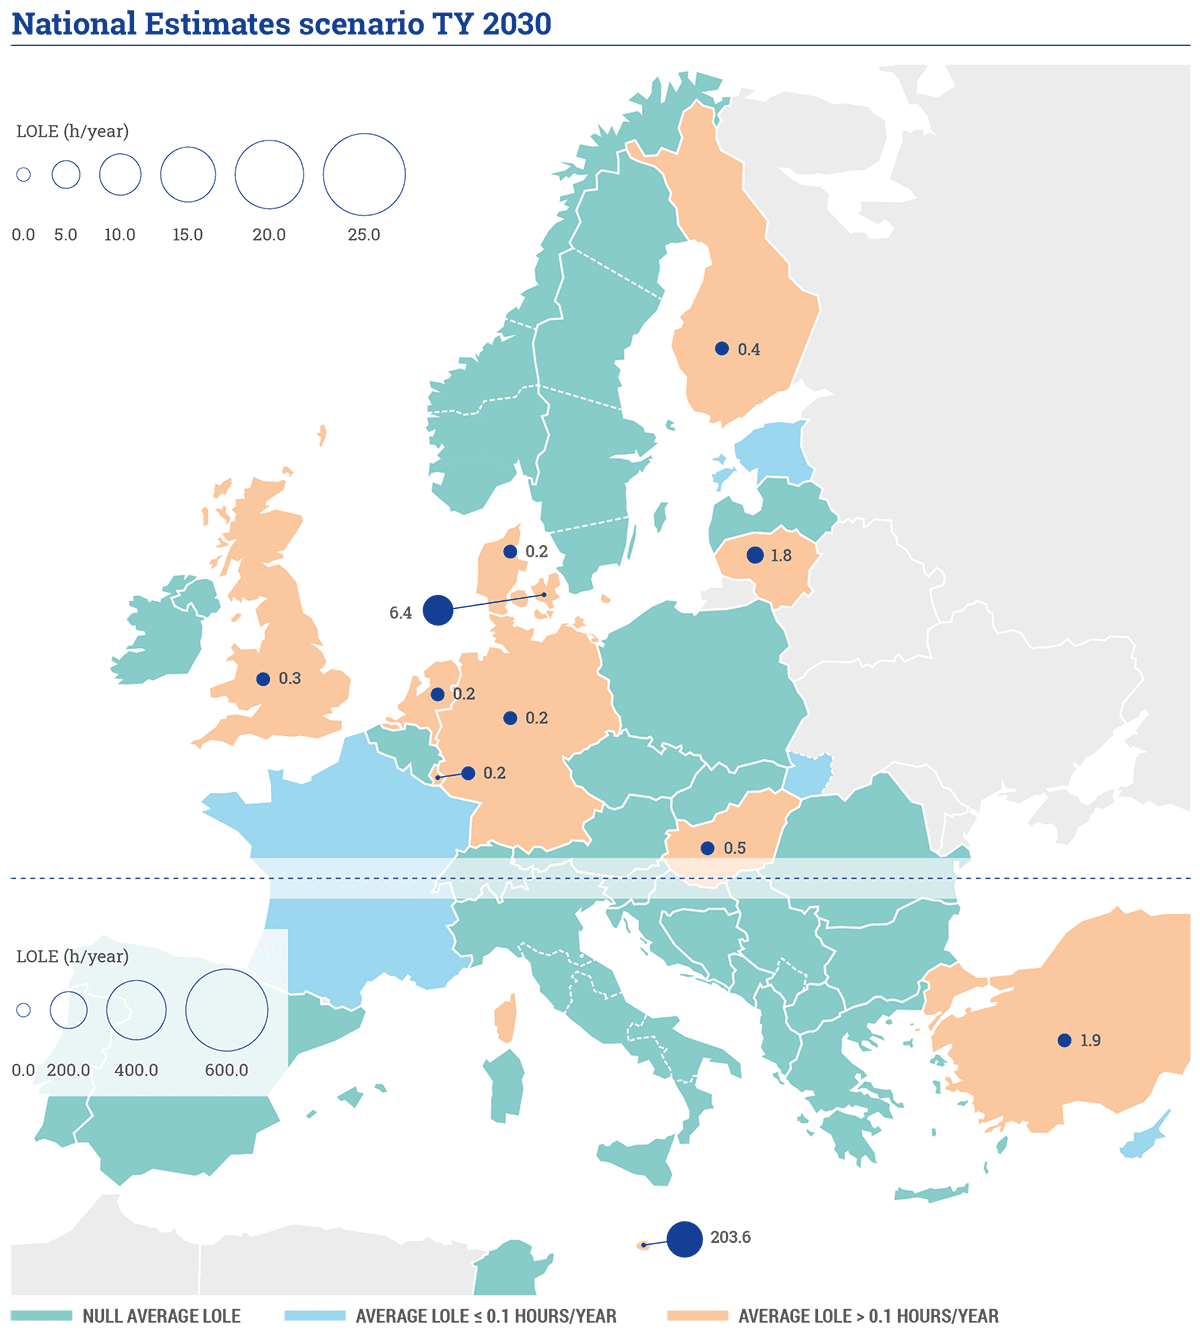
Figure 2: LOLE values for the scenario ‘National Estimates 2030’. Circles for bidding zones with LOLE values smaller than 0.1 hours/year are not represented.
Central scenario with Capacity Mechanism
Implementing an economic viability assessment has led to an overall reduction in thermal capacity, compared to the National Estimates scenario for 2025. More specifically, capacity exit due to non-viability has been observed in most countries of the modelled perimeter, totaling around 75GW of capacity withdrawal. This is mostly coal and lignite generation, and is far greater than the anticipated economic commissioning of 13GW as a result of the EVA, which mainly appears in Turkey.
The results of the economic assessment have naturally a significant impact on the adequacy assessment. Adequacy risks appear all around Europe, as can be observed in Figure 3. Most notable scarcity issues are identified in the islands of Malta, Sardinia4, Sicily, Cyprus, UK and Ireland. In mainland Europe, Czech Republic reaches 15h of LOLE followed by Germany and Luxembourg (~7h), France, Belgium, Denmark and Lithuania (~4 to 4.6h).
Central scenario without Capacity Mechanism
The assumption of CMs brings countries at risk (France, Belgium, UK, Italy, Germany) close to their reliability standards with approximately 5GW additional capacity. This comes either as re-entry or new entry, compared to the scenario without CM. For some zones, e.g. IT, PL, the LOLE is still higher than the RS indicating that more capacity should be anticipated in these zones. Furthermore, the introduced CMs also have a reducing effect on the LOLE values of neighboring countries, e.g. Germany.
4 Note that the reference tool has not sufficiently converged for ITSA for which it would need a higher number of random draws. LOLE is observed to be higher for ITSA when consulting the results of other tools. An overview of the LOLE range and uncertainty can be found by consulting results from other tools in Annex 6.
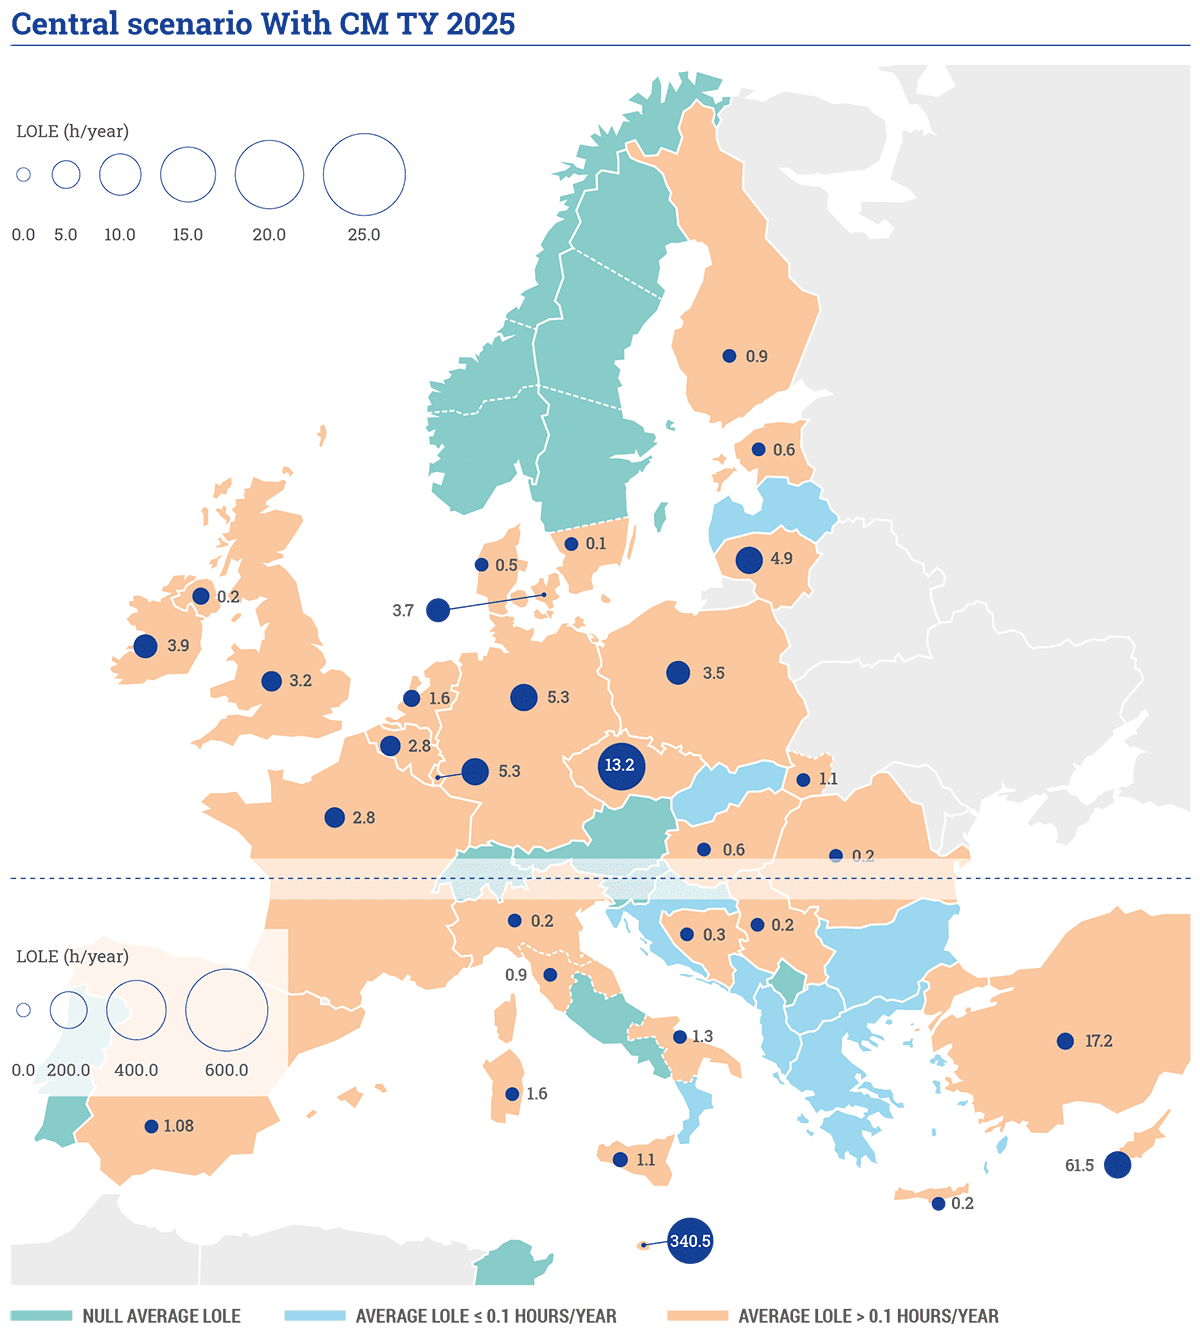
Figure 3: LOLE values for the scenario ‘Central without CM 2025’. Circles for bidding zones with LOLE values equal or smaller than 0.1 hours/year are not represented.
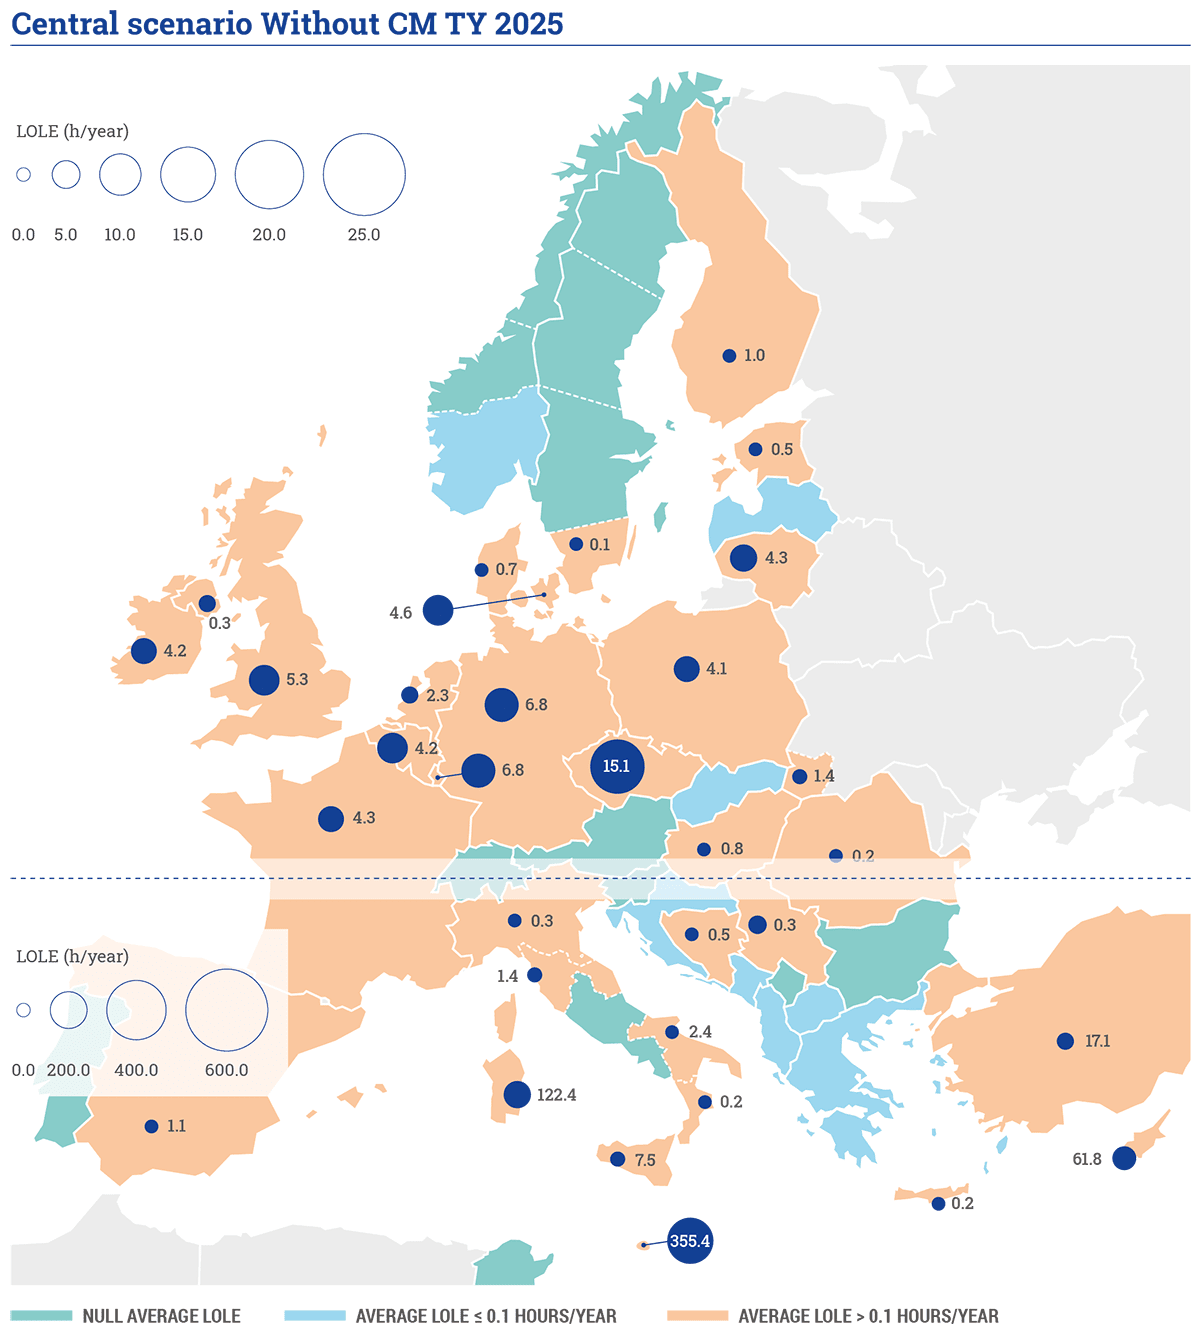
Figure 4: LOLE values for the scenario ‘Central with CM 2025’. Circles for bidding zones with LOLE values smaller than 0.1 hours/year are not represented.
National Estimates Low Thermal scenario
Similarly to previous sections, the islands face the highest LOLE. In continental Europe Poland, Lithuania, France appear also to have considerable number of loss of load hours, due to the reduced available capacity in the corresponding regions compared to the National Estimates scenario5.
In 2030, around 36GW of thermal capacity is flagged by TSOs as uncertain, with respect to the expectations illustrated in the National Estimates’ scenario. The highest contributions to this reduction in capacity are in Poland, France and Germany, which are reflected in the adequacy results for the corresponding zones.
The uncertainty in the available thermal capacity in Poland, results in significant loss of load expectation and has an appreciable impact also on neighboring zones, for example Lithuania. Denmark is also affected by this scenario, with DKE reaching 11 hours of LOLE. Germany follows with more than 3 hours. In the rest of the European zones risks are rather limited similarly to the adequacy situation in the National Estimates scenario.
5 In case of Poland, only hard coal / lignite units with already concluded contracts on the Capacity Market are considered in the National Estimates with Low Thermal Capacity scenario for the year 2025 and 2030. The remaining units, in this scenario, are early decommissioned as they cannot receive support from the Capacity Market in the present form, due to the 550kg CO2 emission limits coming into force from July 2025. More details can be found in Annex 5 – country comments.
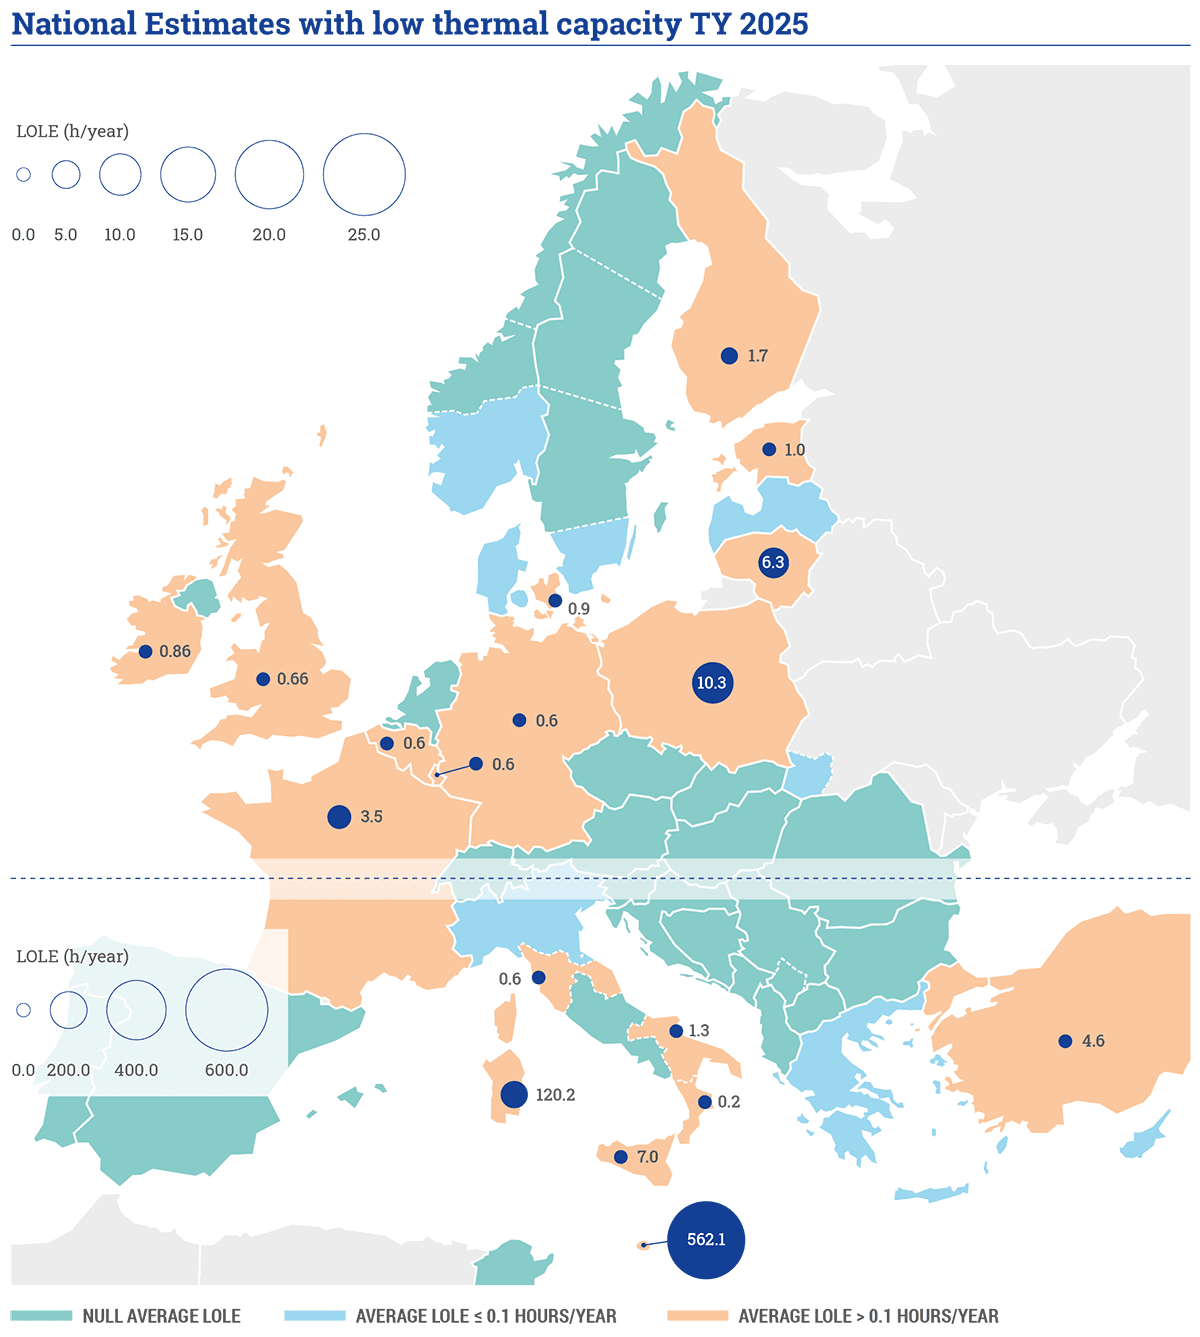
Figure 5: LOLE values for the scenario ‘National Estimates with low thermal capacity 2025’. Circles for bidding zones with LOLE values smaller than 0.1 hours/year are not represented.
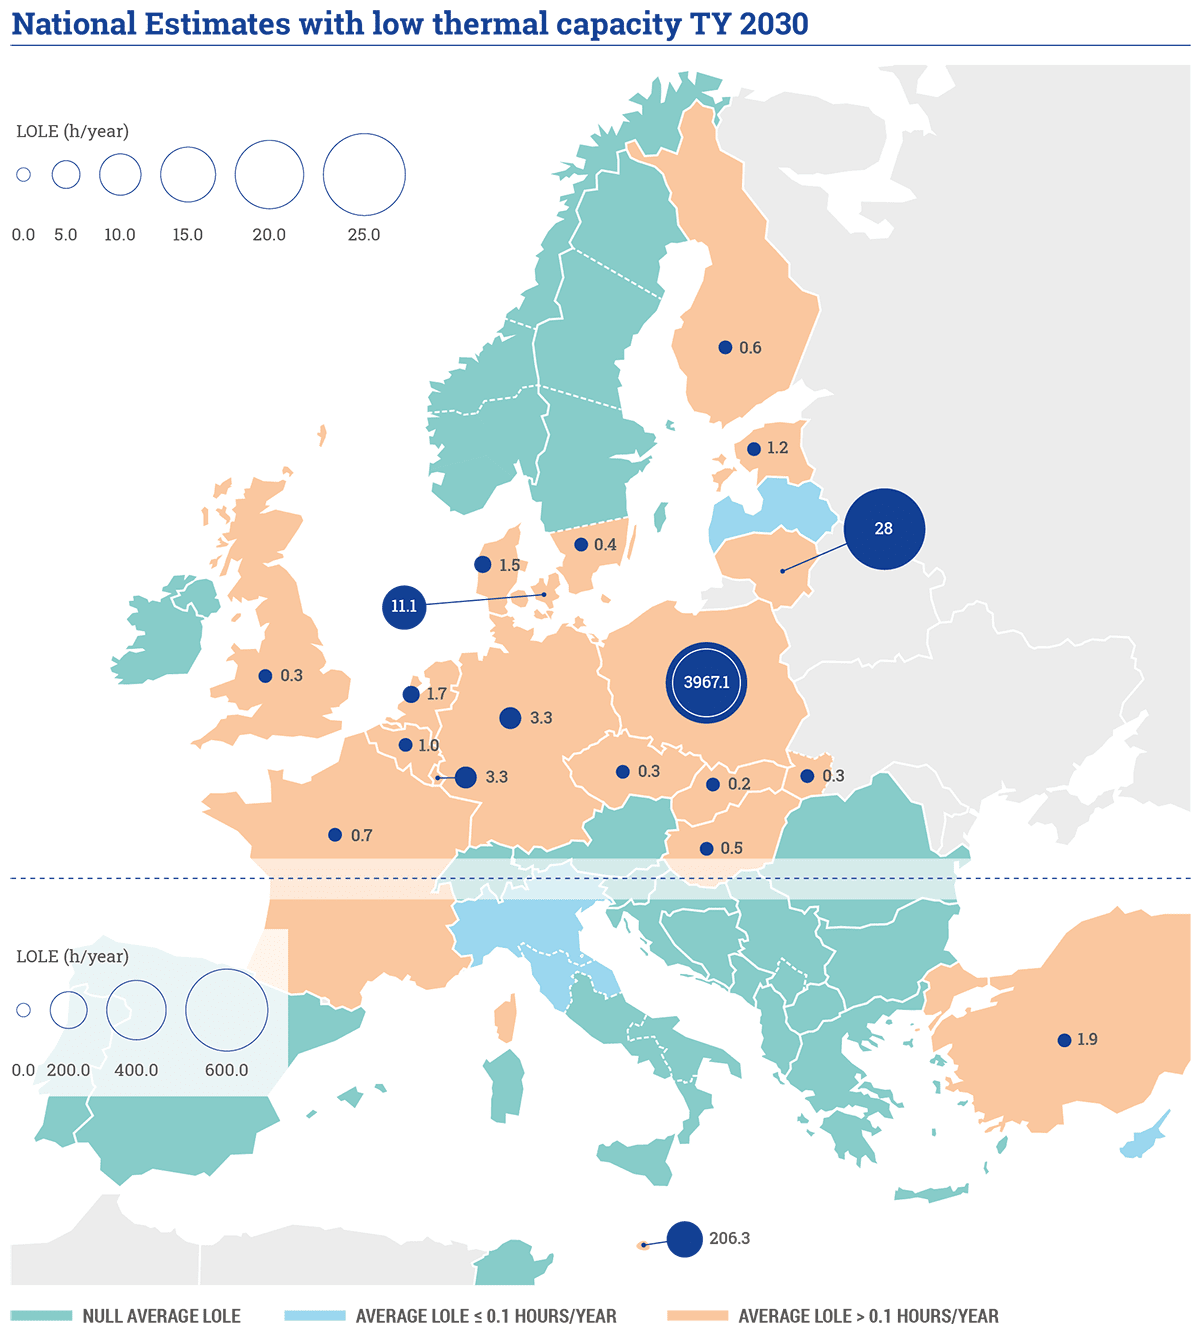
Figure 6: LOLE values for the scenario ‘National Estimates with low thermal capacity 2030’. Circles for bidding zones with LOLE values smaller than 0.1 hours/year are not represented.